I am a person who likes to take action and fight for the underdog, protecting those being taken advantage of. This is why I felt compelled to right a wrong by writing about whether two-graph DISC is better than three-graph DISC.

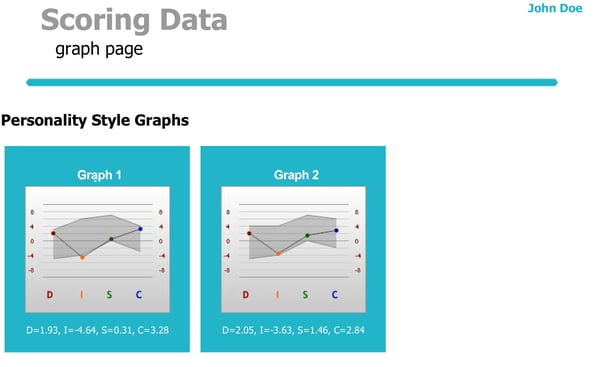
Example of 2-graph DISC profile

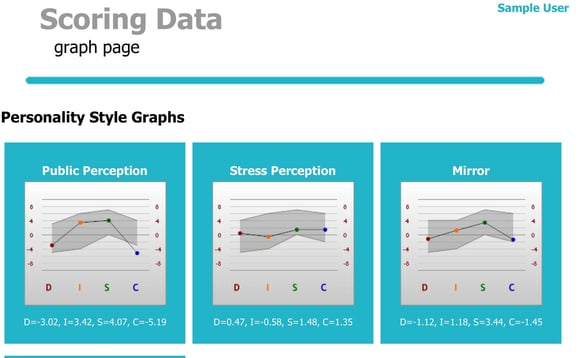
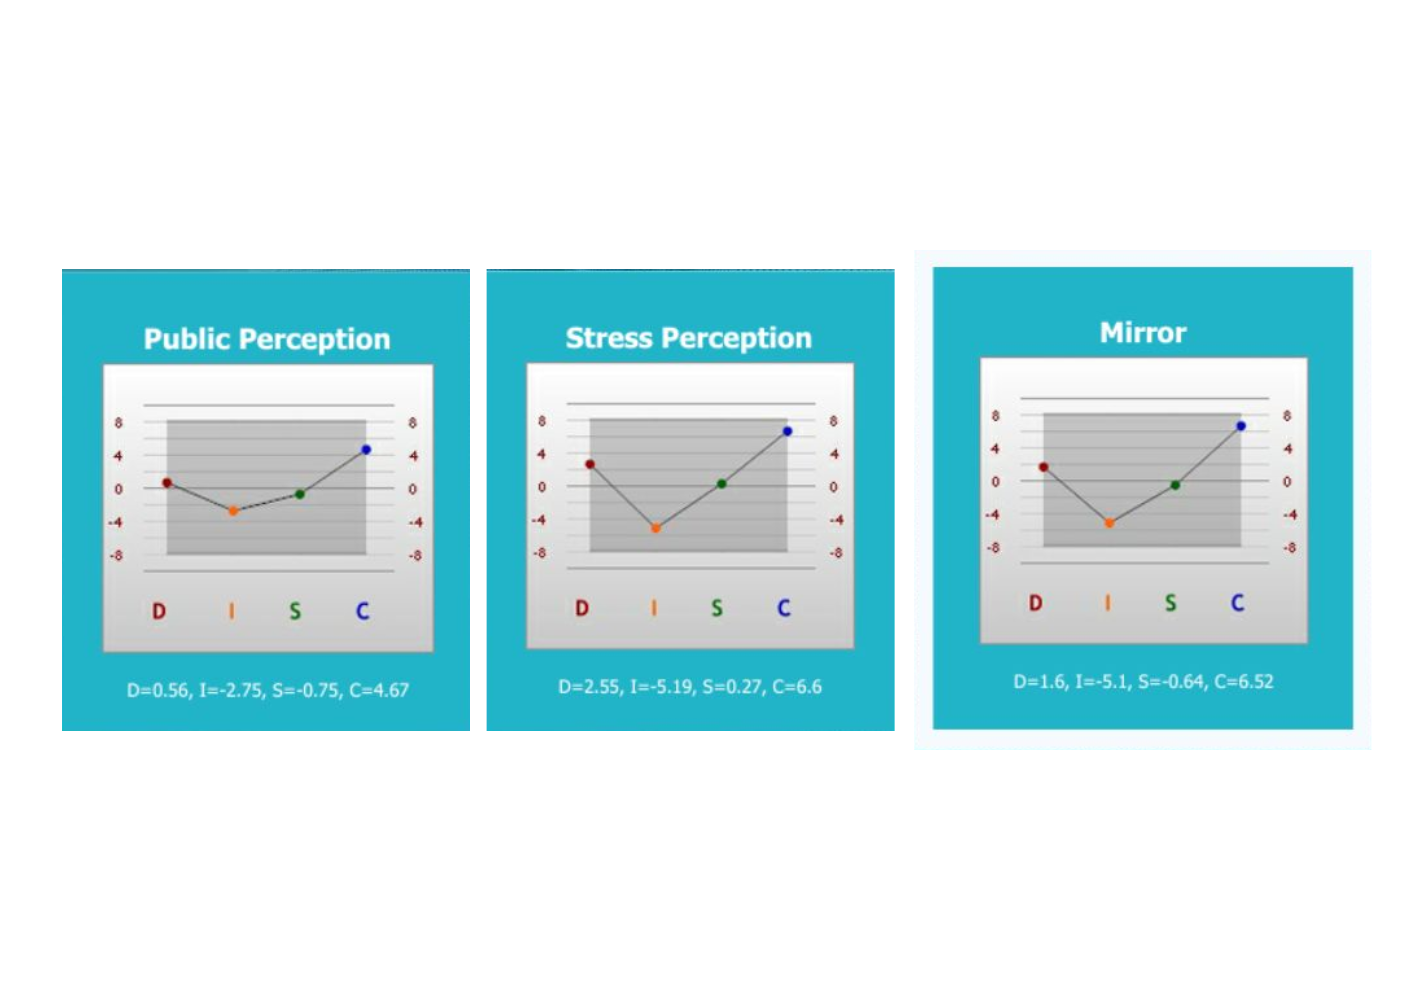
Example of 3-graph DISC profile
PeopleKeys has long been a three-graph provider of DISC, with over 95% of our users agreeing on the close match of their DISC behavioral style. I have always believed that at least 5% of the population who take a DISC assessment do not answer entirely true responses, and thus only 95% claim the reports accurately reflect their style.
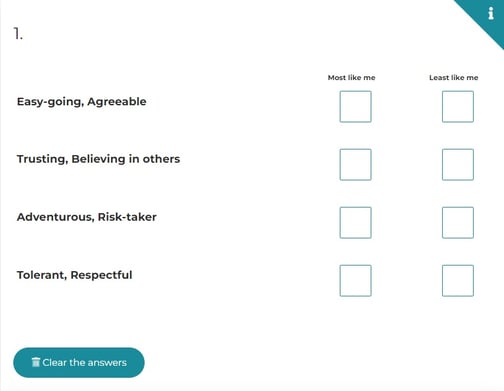
Let me first explain what three-graph and two-graph DISC is. Most DISC assessments give you 24-28 statements, and you then select a “MOST like you” and a “LEAST like you” from four choices (see sample below). The first graph is generated from your “MOST like you” responses and is generally referred to as your public self, mask, adapted self, etc. It is the response to how you like to appear in any given environment. This is also the graph that changes the most, depending upon your environment. That is a topic for another article altogether.

Example of “Most like you” and “Least like you” responses in a DISC assessment
The second graph is then generated by your “LEAST like you” responses. These are typically more difficult to answer, as we all know what we want to be MOST like, however the LEAST like triggers some thought and sometimes a little intentional stress. These responses go into Graph two, which is referred to as your core, private or sometimes even your natural self.
That is where many other DISC providers leave off, and then make statements to mislead about the true accuracy of, Graph three. Graph three, which PeopleKeys generates in our DISC reports, is an average of the first and second graphs, and is entitled the Self Mirror Graph. Approximately 95% of people see themselves as most like this third graph, since it’s hard to always see your own projected (mask) style or your behavior under stressors (the LEAST or second Graph).
Let me share some of the myths that are currently out in the marketplace surrounding this. Certain companies have done a very good job marketing these misconceptions, but are simply not providing the entire truth to the matter.
Have you ever heard or read any of the following statements:
- Only two-graph reports are accurate; the third graph is not generated from data (Not entirely TRUE)
- People tend to act like their second or natural style graph and relate to this the most (Not entirely TRUE)
- If you use a three-graph company, then you are dealing with someone who does not understand the data or statistical ramification of the graph (Completely UNTRUE and the fact is many three-graph publishers, like PeopleKeys, will gladly give you a two-graph report instead)
Take a three-graph assessment and then a two-graph (YES, we will provide either style). Ask people who are close to you which graph is your Mask or Adapted Style. Chances are, they will agree with you on Graph one. Ask what your most natural style is, and both you and your friend will probably agree on Graph three or even back to Graph one again. Ask them how you act under stress and they will point to Graph two. Graph two is not your natural style, it is your behavior under some type of stress.
One of our clients, Major Jeff Kozyra with the United States Air Force Academy, once told us that being able to spot someone operating in their second graph was a “tell” of someone being under certain stressors. It was not their officers’ or pilots’ natural style, it was their stress style.
At PeopleKeys, we offer both two and three-graph report options. Our interest is in our clients receiving the best and most accurate data for their money. While both reports are the same price, clients receive the best value with a three-graph report. Take our DISC assessment and see the results for yourself.


