
An essential coaching skill is the ability to "read" the people you work with. There is no magic in this skill, but a scientific theory called DISC and developed by Dr. William Marston. The DISC Personality Profile provides coaches with in-depth information about their clients. It also helps them to develop action plans toward their clients' goals in life and work.
The Masks of Personality
The full 24-question DISC test results in a report with three graphs that reveal:
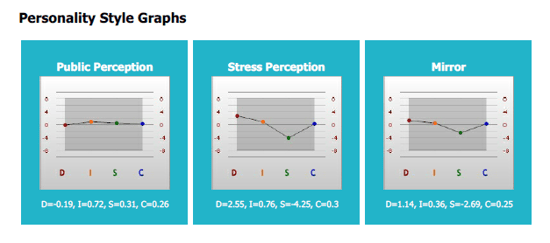
- The person’s mask – their public self. Everyone acts according to how they think other people expect them to.
- The person’s core – their private self. This graph displays one's instinctive response to pressure and is based on a person’s learned reactions.
- The person’s mirror – their perceived self. This graph is the mental picture the person has of him/herself.
These three graphs are a strong indication of one's personality traits in a given environment and their perceived strengths.
Differences in Graphs
Differences between these three graphs have a significant meaning for a trained behavioral consultant and coach. For instance, if the public mask is different than the private mask, this indicates stress as the demands of a person’s environment may be forcing behavior that is not congruent with their core. Such differences may also indicate growth, general transition, or unawareness of the demands of the environment.
In other words, a significant difference between Graph 2 and Graph 1 indicates that your client must adapt their behavior substantially to fit into a workplace or environment. This demand can cause unhappiness and stress if the person is not aware of how to manage it. This is where a coach can help.
Different Dominant DISC Styles
Oftentimes, you can notice different DISC styles showing as dominant traits on Graph 1 and Graph 2. This also has a hidden meaning, i.e.:
- A Higher "D" in Graph 2 than Graph 1 means this person desires more control than they currently have in their environment. By bringing this out to their client, a coach can help their client find ways they may be able to have more control.
- A Higher "I" in Graph 2 than Graph 1 indicates the person needs more social interaction. Again, bringing this to their client’s attention, a coach can help them find ways they may be able to have the social influence they desire.
- If the "S" goes up considerably in Graph 2 than Graph 1, the person likely prefers to avoid conflict, though they cannot do that in their current environment.
- If the "C" goes up considerably in Graph 2 than Graph 1, the person is likely to desire more information before making a decision. Identifying and acknowledging these desires can often help a person make the necessary changes to alleviate stress.
What Does Graph 3 Reveal?
Graph 3 averages the learned responses from the past with the expected behavior from the current environment and gives us an estimate of one's predictable behavior. Looking into special patterns and transitions of personality, these three graphics of the DISC report often give a coach enough information to ask further questions and draw out additional information to assist a client in personal growth and development, relationship building, and more. By being able to narrow down stress areas, a client can often grow toward their goals.
Coaches and consultants can learn more about how to read and apply DISC in their business with DISC Certification.